Drafting for 3 and D
Drafting for 3 and D
Predicting the best shooters from NCAA production and their height to wingspan ratio.
Watching the draft this year I heard a lot of talk about wingspan and shooting ability. Wingspan and length have always been key attributes for any level of basketball. Long arms are more important than height alone since long arms help in rebounding, contesting shots, deflections, getting steals and just generally making it hard on the offense. Shooting is also very important but 3 point shooting has become even more important in today’s modern NBA. Outside of the lottery draft picks, it becomes a crapshoot to try to predict who will be successful.
A lot of players outside of the lottery won’t turn into All Stars but they can turn into solid role players. Every team needs guys to play a role alongside their superstar. One of the most popular current roles is a “3 and D” guy. Someone that can hit threes and play solid defense against opposing players. Historically guys like Robert Horry, Doug Christie, and Shawn Marion or more recently Danny Green, Draymond Green, Kawhi (superstar?), Trevor Ariza and others are great examples.
So I decided to look at some basic NCAA stats(no foreign stats due to inefficiency in finding data), mainly NCAA 3PT% and NCAA FT%, to predict NBA 3PT%. Also I wanted to analyze the wingspan to height ratio of players to determine their length attribute.
Importing the Modules and Getting the Data
I used Beautiful Soup and requests for scraping and parsing data from Basketball Reference. Also I used seaborn for creating some pretty data visualization. Here I also created my helper functions for accessing the webpage and finding the html table as well as the function to loop through all of the players and retrieve their stats.
%matplotlib inline
from bs4 import BeautifulSoup
import requests
import pandas as pd
import numpy as np
import scipy.stats as ss
import statsmodels.api as sm
import matplotlib.pyplot as plt
import seaborn as sns

def get_cbb_game_table(player):
    url = "http://www.sports-reference.com/cbb/players/%s-1.html" % (player)
    r = requests.get(url).text
    soup = BeautifulSoup(r, 'lxml')
    perGame = soup.find(id='players_per_game')
    return perGame

def get_stats(playersDF):
    shooters = playersDF["Player"].str.replace(' ','-').str.lower()
    playersDF['Player'] = shooters
    #get ncaa stats from url
    headerTable = get_cbb_game_table(shooters[0])

    #get column names
    header = headerTable.find('thead').findAll('th', text=True)
    colNames = ['Player']
    for name in header:
        colNames.append(name.get_text())
    stats = []
    #get totals for each player
    for p in shooters:
        perGame = get_cbb_game_table(p)
        #if player has ncaa stats available
        if perGame:
            perGameTotals =perGame.find('tfoot').findAll('td')
            statRow = [p]
            for stat in perGameTotals:
                statRow.append(stat.get_text())
            #handle ncaa transfer stats AKA toney douglas rule First 25 values only
            stats.append(statRow[0:25])
        #else remove from nba dataframe
        else:
            playersDF = playersDF[shooters != p]
    statsDF = pd.DataFrame(stats, columns = colNames)
    statsDF = statsDF.apply(pd.to_numeric, errors = 'ignore')
    return statsDF
#previously downloaded a csv with all NBA players from 2000-2016 with 3 point attemps > 300
#thanks to http://www.basketball-reference.com
nba = pd.read_csv("3PAgreater300.csv")
#this will take awhile maybe grab a beer or some coffee while you wait.
#also basketball-reference.com doesn't like it when we crawl their site so crawl it once and save as a csv for later use.
ncaa = get_stats(nba)
ncaa.to_csv("ncaa.csv")
/home/scott/anaconda3/lib/python3.5/site-packages/ipykernel/__main__.py:43: UserWarning: Boolean Series key will be reindexed to match DataFrame index.
Tidying Up the Data
I chose to only accept players who shot at least 1 three point attempt per game in college and I merged the ncaa dataframe with the nba data frame into one data frame called shot_data.
#only accepting players who took at least 1 3PA per game in college
ncaa = ncaa[ncaa['3PA']>1]
shot_data = ncaa[['Player',"3P%","FT%"]]
shot_data=shot_data.rename(columns = {'3P%':'ncaa_3P','FT%':'ncaa_FT'})
shot_data.Player = shot_data.Player.str.replace("-"," ")
shot_data.Player = shot_data.Player.str.title()
shot_data.Player = shot_data.Player.str.strip()
shot_data = pd.merge(pd.DataFrame(shot_data),pd.DataFrame(nba[["Player","3P%"]]),left_index=True,right_index=True)
shot_data=shot_data.rename(columns = {'3P%':'3P'})
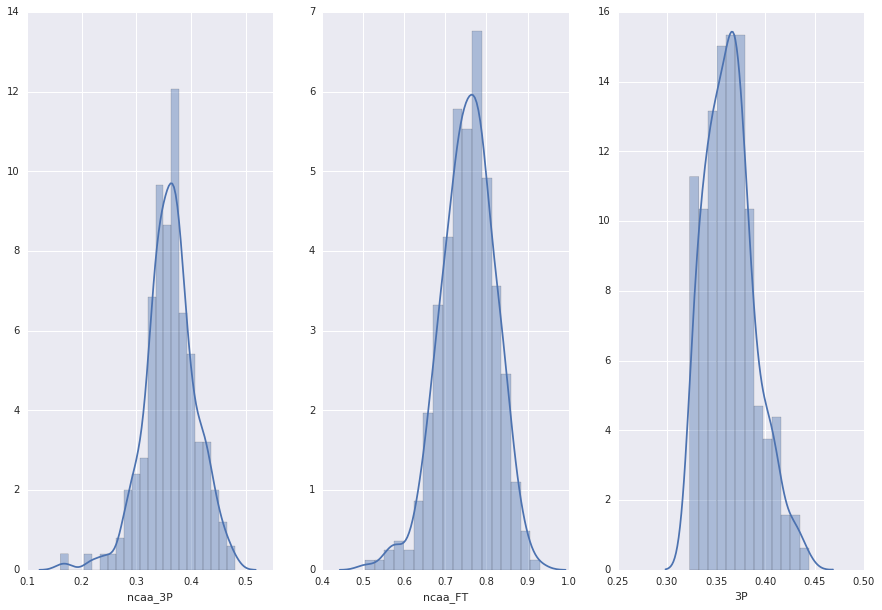
Checking for Normality of the Independent Variables
#shot_data.hist( alpha=0.5, bins=20, layout=(1,3), figsize=(20,10))
f, axs = plt.subplots(1,3,figsize=(15,10))

plt.subplot(1,3,1)
sns.distplot(shot_data['ncaa_3P'])

plt.subplot(1,3,2)
sns.distplot(shot_data['ncaa_FT'])

plt.subplot(1,3,3)
sns.distplot(shot_data['3P'])
<matplotlib.axes._subplots.AxesSubplot at 0x7f4551764860>
Finding and Removing Outliers
Outliers can have a negative effect on linear regression so I decided to remove any outliers. I used the basic definition for outliers as any value less than 1.5Lower Quartile and greater than 1.5Upper Quartile.
#basic outlier test:omit observation if abs_val of observation > 1.5*IQR
q1 = shot_data.quantile(.25)
q3= shot_data.quantile(.75)
iqr = pd.concat([q1, q3], axis=1, keys=['q1', 'q3'])
iqr['iqr'] = iqr['q3'] - iqr['q1']
iqr['max'] = iqr['q3'] + 1.5*iqr['iqr']
iqr['min'] = iqr['q1'] - 1.5*iqr['iqr']

iqr.head()
| q1 | q3 | iqr | max | min | |
|---|---|---|---|---|---|
| ncaa_3P | 0.3360 | 0.3880 | 0.0520 | 0.46600 | 0.25800 |
| ncaa_FT | 0.7135 | 0.7975 | 0.0840 | 0.92350 | 0.58750 |
| 3P | 0.3450 | 0.3785 | 0.0335 | 0.42875 | 0.29475 |
#exlude outliers
shot_data = shot_data[shot_data['ncaa_3P']<iqr['max'][0]]
shot_data = shot_data[shot_data['ncaa_FT']<iqr['max'][1]]
shot_data = shot_data[shot_data['ncaa_3P']>iqr['min'][0]]
shot_data = shot_data[shot_data['ncaa_FT']>iqr['min'][1]]

print(shot_data)
                    Player_x  ncaa_3P  ncaa_FT                  Player_y  \
0              Stephen Curry    0.412    0.876             stephen-curry
1               Hubert Davis    0.435    0.819              hubert-davis
2               Jason Kapono    0.446    0.830              jason-kapono
3                 Steve Nash    0.401    0.867                steve-nash
4              Wesley Person    0.441    0.747             wesley-person
6                Kyle Korver    0.453    0.891               kyle-korver
7                Danny Ferry    0.388    0.775               danny-ferry
8             Anthony Morrow    0.421    0.867            anthony-morrow
9              Klay Thompson    0.390    0.827              terry-porter
10               Brent Barry    0.345    0.794             klay-thompson
11               Matt Bonner    0.395    0.740               brent-barry
12                 Jon Barry    0.371    0.717               matt-bonner
13            Doug Mcdermott    0.458    0.831                 jon-barry
14           Eric Piatkowski    0.358    0.777             jose-calderon
15          Kelenna Azubuike    0.373    0.752               j.j.-redick
16              Fred Hoiberg    0.400    0.844            doug-mcdermott
17            Anthony Parker    0.379    0.750           eric-piatkowski
18            Anthony Peeler    0.393    0.779          kelenna-azubuike
19          Wally Szczerbiak    0.431    0.809              fred-hoiberg
20             Daniel Gibson    0.387    0.741            anthony-parker
21               Mike Miller    0.345    0.718            anthony-peeler
22                 Raja Bell    0.350    0.731          wally-szczerbiak
23                 Ray Allen    0.448    0.779             c.j.-mccollum
24              Luke Babbitt    0.421    0.893             daniel-gibson
25               Danny Green    0.375    0.845               mike-miller
26              Brandon Rush    0.435    0.733                 raja-bell
27                Ben Gordon    0.423    0.795           peja-stojakovic
28           Khris Middleton    0.321    0.768                 ray-allen
29              Jared Dudley    0.365    0.731              luke-babbitt
30             Walt Williams    0.359    0.762               danny-green
..                       ...      ...      ...                       ...
343               Lamar Odom    0.330    0.687             landry-fields
345            Chris Johnson    0.371    0.826               josh-howard
346          Jordan Crawford    0.384    0.765              shawn-marion
347             Ronnie Price    0.345    0.788             dahntay-jones
348              Evan Turner    0.362    0.758             adam-morrison
349             Donte Greene    0.345    0.707         darrell-armstrong
350           Andrew Wiggins    0.341    0.775               brad-miller
351           Antoine Wright    0.376    0.648            antoine-walker
352              Will Barton    0.299    0.733            damien-wilkins
354             Derrick Rose    0.337    0.712                trey-burke
355        Russell Westbrook    0.354    0.685            josh-childress
356         Yakhouba Diawara    0.343    0.650              jamario-moon
358           George Mccloud    0.429    0.778              jimmy-butler
359           Jamaal Tinsley    0.327    0.685                brian-shaw
360         Derrick Williams    0.431    0.813              marcus-banks
361           Rodney Stuckey    0.317    0.806  kentavious-caldwell-pope
362             Marcus Smart    0.295    0.751            raymond-felton
363         Shandon Anderson    0.291    0.634                alonzo-gee
365             Tyreke Evans    0.274    0.711               dan-majerle
366             Corey Brewer    0.356    0.708           stephon-marbury
368              Dwyane Wade    0.333    0.745               tony-parker
370               Tony Allen    0.347    0.682               norris-cole
374           Moochie Norris    0.354    0.699             tobias-harris
375               Will Bynum    0.310    0.739              solomon-hill
376            James Johnson    0.370    0.792            corey-maggette
379           Anthony Carter    0.330    0.714               jae-crowder
380  Michael Carter Williams    0.307    0.679              devin-harris
381            Ronnie Brewer    0.340    0.671              shelvin-mack
382          Marquis Daniels    0.296    0.646           dennis-schroder
384             Andre Miller    0.294    0.676               baron-davis

        3P
0    0.444
1    0.440
2    0.434
3    0.432
4    0.432
6    0.429
7    0.425
8    0.425
9    0.421
10   0.420
11   0.419
12   0.414
13   0.413
14   0.412
15   0.412
16   0.410
17   0.410
18   0.409
19   0.409
20   0.409
21   0.409
22   0.409
23   0.408
24   0.407
25   0.407
26   0.406
27   0.406
28   0.403
29   0.403
30   0.403
..     ...
343  0.332
345  0.332
346  0.332
347  0.331
348  0.331
349  0.330
350  0.330
351  0.330
352  0.330
354  0.329
355  0.329
356  0.329
358  0.328
359  0.328
360  0.327
361  0.327
362  0.327
363  0.327
365  0.327
366  0.327
368  0.327
370  0.326
374  0.325
375  0.325
376  0.325
379  0.324
380  0.324
381  0.324
382  0.324
384  0.323

[327 rows x 5 columns]
Regression Analysis
After running the regression analysis I was able to calculate my coefficients for my formula as well as the R-squared value. Notice the R-squared value is really low which can be problematic. To look at this model more in depth I took a look at the residuals.
#set up and run ordinary least squares regression
Y = shot_data["3P"]
X = shot_data[["ncaa_3P","ncaa_FT"]]
X = sm.add_constant(X)

result = sm.OLS(Y,X, missing = "drop").fit()
print(result.summary())
shot_data_pred = shot_data
shot_data_pred['pred'] = result.fittedvalues
shot_data_pred['resid'] = result.resid
print(shot_data_pred[["Player_x","3P",'pred']])
                            OLS Regression Results
==============================================================================
Dep. Variable:                     3P   R-squared:                       0.198
Model:                            OLS   Adj. R-squared:                  0.193
Method:                 Least Squares   F-statistic:                     40.05
Date:                Fri, 08 Jul 2016   Prob (F-statistic):           2.87e-16
Time:                        07:27:38   Log-Likelihood:                 779.47
No. Observations:                 327   AIC:                            -1553.
Df Residuals:                     324   BIC:                            -1542.
Df Model:                           2
Covariance Type:            nonrobust
==============================================================================
                 coef    std err          t      P>|t|      [95.0% Conf. Int.]
------------------------------------------------------------------------------
const          0.2213      0.017     13.286      0.000         0.189     0.254
ncaa_3P        0.1596      0.035      4.524      0.000         0.090     0.229
ncaa_FT        0.1127      0.024      4.718      0.000         0.066     0.160
==============================================================================
Omnibus:                       11.468   Durbin-Watson:                   0.350
Prob(Omnibus):                  0.003   Jarque-Bera (JB):               12.158
Skew:                           0.465   Prob(JB):                      0.00229
Kurtosis:                       2.834   Cond. No.                         39.8
==============================================================================

Warnings:
[1] Standard Errors assume that the covariance matrix of the errors is correctly specified.
                    Player_x     3P      pred
0              Stephen Curry  0.444  0.385740
1               Hubert Davis  0.440  0.382989
2               Jason Kapono  0.434  0.385983
3                 Steve Nash  0.432  0.382970
4              Wesley Person  0.432  0.375835
6                Kyle Korver  0.429  0.393972
7                Danny Ferry  0.425  0.370532
8             Anthony Morrow  0.425  0.386162
9              Klay Thompson  0.421  0.376709
10               Brent Barry  0.420  0.365811
11               Matt Bonner  0.419  0.367706
12                 Jon Barry  0.414  0.361286
13            Doug Mcdermott  0.413  0.388011
14           Eric Piatkowski  0.412  0.365970
15          Kelenna Azubuike  0.412  0.365548
16              Fred Hoiberg  0.410  0.380220
17            Anthony Parker  0.410  0.366280
18            Anthony Peeler  0.409  0.371781
19          Wally Szczerbiak  0.409  0.381224
20             Daniel Gibson  0.409  0.366542
21               Mike Miller  0.409  0.357249
22                 Raja Bell  0.409  0.359512
23                 Ray Allen  0.408  0.380557
24              Luke Babbitt  0.407  0.389091
25               Danny Green  0.407  0.376343
26              Brandon Rush  0.406  0.373300
27                Ben Gordon  0.406  0.378370
28           Khris Middleton  0.403  0.359052
29              Jared Dudley  0.403  0.361905
30             Walt Williams  0.403  0.364440
..                       ...    ...       ...
343               Lamar Odom  0.332  0.351364
345            Chris Johnson  0.332  0.373565
346          Jordan Crawford  0.332  0.368767
347             Ronnie Price  0.331  0.365135
348              Evan Turner  0.331  0.364468
349             Donte Greene  0.330  0.356010
350           Andrew Wiggins  0.330  0.363032
351           Antoine Wright  0.330  0.354310
352              Will Barton  0.330  0.351599
354             Derrick Rose  0.329  0.355297
355        Russell Westbrook  0.329  0.354968
356         Yakhouba Diawara  0.329  0.349270
358           George Mccloud  0.328  0.377412
359           Jamaal Tinsley  0.328  0.350660
360         Derrick Williams  0.327  0.381674
361           Rodney Stuckey  0.327  0.362695
362             Marcus Smart  0.327  0.352988
363         Shandon Anderson  0.327  0.339170
365             Tyreke Evans  0.327  0.345131
366             Corey Brewer  0.327  0.357878
368              Dwyane Wade  0.327  0.358376
370               Tony Allen  0.326  0.353513
374           Moochie Norris  0.325  0.356545
375               Will Bynum  0.325  0.354030
376            James Johnson  0.325  0.369575
379           Anthony Carter  0.324  0.354405
380  Michael Carter Williams  0.324  0.346792
381            Ronnie Brewer  0.324  0.351157
382          Marquis Daniels  0.324  0.341320
384             Andre Miller  0.323  0.344380

[327 rows x 3 columns]
Residuals
Taking a look at the residuals can help determine what might be wrong with this model.
#check residual plots
f, axs = plt.subplots(2,2,figsize=(10,6))
plt.subplot(2,2,1)
sns.residplot(shot_data['ncaa_3P'],shot_data['resid'])
low = shot_data['resid'].min()
high = shot_data['resid'].max()
plt.plot((.42, .42), (low-.01,high+.02), 'r--')
plt.title("NCAA 3P% vs Residuals")

plt.subplot(2,2,2)
sns.residplot(shot_data['ncaa_FT'],shot_data['resid'])
plt.title("NCAA FT% vs Residuals")


plt.subplot(2,2,3)
ax0 = sns.residplot(shot_data['3P'],shot_data['resid'])
plt.title("Actual 3P% vs Residuals")

plt.subplot(2,2,4)
ax = sns.distplot(shot_data['resid'])
#plt.hist(shot_data['resid'])
plt.title("Residuals Distribution")
plt.tight_layout(pad=0.4, w_pad=0.5, h_pad=1)
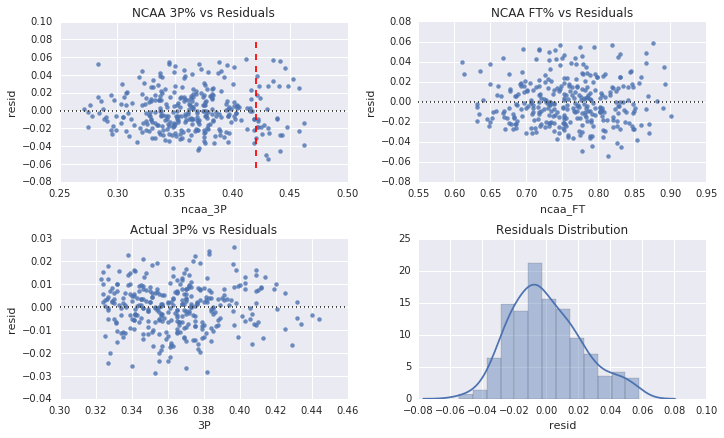
Looking at the NCAA 3P% vs Residuals the model is not as accurate with NCAA 3P% greater than ~40%. The residuals show that this model might not be the best predictor especially for the extreme values such as 3P% > .40.
Predicting Drafted College 3 and D Players
I will use the same model from above to predict 3 point percentage for all drafted NCAA players and also display their ratio of wingspan to height.
#previously downloaded csv from http://www.sports-reference.com
draft = pd.read_csv("draftees.csv")
draft_ncaa = get_stats(draft)
print (draft)
/home/scott/anaconda3/lib/python3.5/site-packages/ipykernel/__main__.py:43: UserWarning: Boolean Series key will be reindexed to match DataFrame index.


    Pk   Tm              Player                          College
0    1  PHI         ben-simmons       Louisiana State University
1    2  LAL      brandon-ingram                  Duke University
2    3  BOS        jaylen-brown         University of California
3    5  MIN           kris-dunn               Providence College
4    6  NOP         buddy-hield           University of Oklahoma
5    7  DEN        jamal-murray           University of Kentucky
6    8  SAC    marquesse-chriss         University of Washington
7    9  TOR        jakob-poeltl               University of Utah
8   11  ORL    domantas-sabonis               Gonzaga University
9   12  UTA      taurean-prince                Baylor University
10  14  CHI    denzel-valentine        Michigan State University
11  17  MEM        wade-baldwin            Vanderbilt University
12  18  DET      henry-ellenson             Marquette University
13  19  DEN       malik-beasley         Florida State University
14  20  IND        caris-levert           University of Michigan
15  21  ATL      deandre-bembry        Saint Joseph's University
16  22  CHO  malachi-richardson              Syracuse University
17  25  LAC       brice-johnson     University of North Carolina
18  27  TOR       pascal-siakam      New Mexico State University
19  28  PHO     skal-labissiere           University of Kentucky
20  29  SAS     dejounte-murray         University of Washington
21  30  GSW        damion-jones            Vanderbilt University
22  31  BOS       deyonta-davis        Michigan State University
23  33  LAC       cheick-diallo             University of Kansas
24  34  PHO          tyler-ulis           University of Kentucky
25  36  MIL     malcolm-brogdon           University of Virginia
26  37  HOU      chinanu-onuaku         University of Louisville
27  38  MIL       patrick-mccaw  University of Nevada, Las Vegas
28  40  NOP       diamond-stone           University of Maryland
29  41  ORL   stephen-zimmerman  University of Nevada, Las Vegas
30  42  UTA    isaiah-whitehead            Seton Hall University
31  45  BOS   demetrius-jackson         University of Notre Dame
32  46  DAL        a.j.-hammons                Purdue University
33  47  ORL         jake-layman           University of Maryland
34  49  DET     michael-gbinije              Syracuse University
35  50  IND       georges-niang            Iowa State University
36  51  BOS          ben-bentil               Providence College
37  52  UTA       joel-bolomboy           Weber State University
38  54  ATL          kay-felder               Oakland University
39  55  BRK        marcus-paige     University of North Carolina
40  56  DEN     daniel-hamilton        University of Connecticut
41  58  BOS         abdel-nader            Iowa State University
42  59  SAC      isaiah-cousins           University of Oklahoma
43  60  UTA      tyrone-wallace         University of California
#save to csv for easy access later
#draft_ncaa.to_csv("draft_ncaa.csv")
#draft_ncaa = pd.read_csv('draft_ncaa.csv')
draft = draft.merge(draft_ncaa, on='Player')
print(draft)
    Pk   Tm              Player                          College  Season  \
0    1  PHI         ben-simmons       Louisiana State University  Career
1    2  LAL      brandon-ingram                  Duke University  Career
2    3  BOS        jaylen-brown         University of California  Career
3    5  MIN           kris-dunn               Providence College  Career
4    6  NOP         buddy-hield           University of Oklahoma  Career
5    7  DEN        jamal-murray           University of Kentucky  Career
6    9  TOR        jakob-poeltl               University of Utah  Career
7   11  ORL    domantas-sabonis               Gonzaga University  Career
8   12  UTA      taurean-prince                Baylor University  Career
9   14  CHI    denzel-valentine        Michigan State University  Career
10  17  MEM        wade-baldwin            Vanderbilt University  Career
11  18  DET      henry-ellenson             Marquette University  Career
12  19  DEN       malik-beasley         Florida State University  Career
13  20  IND        caris-levert           University of Michigan  Career
14  21  ATL      deandre-bembry        Saint Joseph's University  Career
15  22  CHO  malachi-richardson              Syracuse University  Career
16  25  LAC       brice-johnson     University of North Carolina  Career
17  27  TOR       pascal-siakam      New Mexico State University  Career
18  28  PHO     skal-labissiere           University of Kentucky  Career
19  29  SAS     dejounte-murray         University of Washington  Career
20  31  BOS       deyonta-davis        Michigan State University  Career
21  33  LAC       cheick-diallo             University of Kansas  Career
22  34  PHO          tyler-ulis           University of Kentucky  Career
23  36  MIL     malcolm-brogdon           University of Virginia  Career
24  37  HOU      chinanu-onuaku         University of Louisville  Career
25  38  MIL       patrick-mccaw  University of Nevada, Las Vegas  Career
26  40  NOP       diamond-stone           University of Maryland  Career
27  42  UTA    isaiah-whitehead            Seton Hall University  Career
28  45  BOS   demetrius-jackson         University of Notre Dame  Career
29  47  ORL         jake-layman           University of Maryland  Career
30  49  DET     michael-gbinije              Syracuse University  Career
31  50  IND       georges-niang            Iowa State University  Career
32  51  BOS          ben-bentil               Providence College  Career
33  52  UTA       joel-bolomboy           Weber State University  Career
34  55  BRK        marcus-paige     University of North Carolina  Career
35  56  DEN     daniel-hamilton        University of Connecticut  Career
36  58  BOS         abdel-nader            Iowa State University  Career
37  59  SAC      isaiah-cousins           University of Oklahoma  Career
38  60  UTA      tyrone-wallace         University of California  Career

                      School  Conf    G    MP   FG  ...    FT  FTA    FT%  \
0                        LSU   NaN   33  34.9  6.5  ...   6.0  9.0  0.670
1                       Duke   NaN   36  34.6  5.9  ...   3.2  4.7  0.682
2   University of California   NaN   34  27.6  4.8  ...   4.2  6.4  0.654
3                 Providence   NaN   95  31.5  4.5  ...   3.1  4.5  0.693
4                   Oklahoma   NaN  132  31.7  5.9  ...   2.8  3.4  0.836
5                   Kentucky   NaN   36  35.2  6.8  ...   3.3  4.2  0.783
6                       Utah   NaN   70  26.9  5.1  ...   3.1  5.2  0.607
7                    Gonzaga   NaN   74  26.6  5.2  ...   3.1  4.2  0.729
8                     Baylor   NaN  129  20.2  3.6  ...   2.0  2.8  0.718
9             Michigan State   NaN  144  29.0  4.0  ...   1.5  2.0  0.779
10                Vanderbilt   NaN   68  29.6  3.4  ...   3.5  4.4  0.800
11                 Marquette   NaN   33  33.5  5.9  ...   4.3  5.8  0.749
12             Florida State   NaN   34  29.8  5.4  ...   3.1  3.8  0.813
13                  Michigan   NaN  103  26.4  3.6  ...   2.0  2.6  0.770
14              St. Joseph's   NaN  101  36.1  5.7  ...   3.1  4.9  0.628
15                  Syracuse   NaN   37  34.4  4.1  ...   3.1  4.2  0.720
16                       UNC   NaN  148  21.0  4.8  ...   1.9  2.8  0.708
17          New Mexico State   NaN   68  32.7  6.5  ...   3.5  5.0  0.711
18                  Kentucky   NaN   36  15.8  2.7  ...   1.1  1.7  0.661
19                Washington   NaN   34  33.5  5.9  ...   3.2  4.9  0.663
20            Michigan State   NaN   35  18.6  3.4  ...   0.7  1.1  0.605
21                    Kansas   NaN   27   7.5  1.2  ...   0.6  1.0  0.556
22                  Kentucky   NaN   72  30.1  3.6  ...   2.9  3.4  0.846
23                  Virginia   NaN  136  30.6  4.4  ...   3.1  3.5  0.876
24                Louisville   NaN   66  21.0  2.8  ...   0.7  1.3  0.547
25                      UNLV   NaN   65  31.7  4.2  ...   1.9  2.5  0.753
26                  Maryland   NaN   35  23.1  4.8  ...   2.9  3.8  0.761
27                Seton Hall   NaN   56  30.5  5.1  ...   3.5  4.6  0.757
28                   Pacific   NaN   57   NaN  4.2  ...   3.3  4.0  0.837
29                  Maryland   NaN  141  27.9  3.4  ...   1.9  2.6  0.759
30                   Overall   NaN  120  25.5  3.4  ...   1.7  2.6  0.639
31                Iowa State   NaN  138  29.8  6.2  ...   2.5  3.2  0.763
32                Providence   NaN   69  27.9  4.7  ...   3.6  4.8  0.761
33               Weber State   NaN  130  28.8  3.8  ...   3.6  5.0  0.713
34                       UNC   NaN  141  32.4  4.2  ...   2.5  2.9  0.844
35                     UConn   NaN   71  31.6  4.2  ...   2.0  2.6  0.772
36                   Overall   NaN  117  24.3  3.7  ...   1.8  2.5  0.731
37                  Oklahoma   NaN  137  27.7  3.5  ...   1.5  2.1  0.711
38  University of California   NaN  129  31.6  4.6  ...   2.6  4.2  0.613

     TRB  AST  STL  BLK  TOV   PF   PTS
0   11.8  4.8  2.0  0.8  3.4  2.8  19.2
1    6.8  2.0  1.1  1.4  2.0  2.1  17.3
2    5.4  2.0  0.8  0.6  3.1  3.2  14.6
3    5.1  5.8  2.2  0.4  3.3  2.9  12.8
4    5.0  1.9  1.3  0.3  2.2  2.0  17.4
5    5.2  2.2  1.0  0.3  2.3  2.1  20.0
6    8.0  1.3  0.5  1.7  1.8  2.4  13.3
7    9.4  1.3  0.5  0.6  2.0  3.0  13.5
8    4.2  1.1  0.9  0.5  1.7  2.1  10.2
9    5.9  4.4  0.9  0.3  2.2  2.1  11.4
10   4.1  4.8  1.3  0.2  2.3  2.5  11.6
11   9.7  1.8  0.8  1.5  2.4  2.5  17.0
12   5.3  1.5  0.9  0.2  1.7  2.2  15.6
13   3.5  2.7  0.9  0.2  1.3  1.5  10.4
14   6.7  3.6  1.4  0.8  2.5  2.5  15.7
15   4.3  2.1  1.1  0.3  2.1  2.5  13.4
16   7.0  0.9  0.8  1.1  1.3  2.5  11.6
17   9.7  1.5  0.9  2.0  1.9  2.6  16.5
18   3.1  0.3  0.3  1.6  0.9  3.0   6.6
19   6.0  4.4  1.8  0.3  3.2  2.6  16.1
20   5.5  0.7  0.3  1.8  0.9  2.3   7.5
21   2.5  0.0  0.3  0.9  0.6  1.4   3.0
22   2.4  5.3  1.2  0.1  1.5  1.7  11.3
23   4.1  2.5  0.9  0.2  1.5  1.8  13.3
24   6.4  1.1  0.8  1.6  1.7  2.7   6.2
25   4.2  3.3  2.0  0.4  1.9  1.9  12.2
26   5.4  0.4  0.5  1.6  1.5  2.3  12.5
27   3.7  4.5  1.3  1.1  3.4  2.3  15.8
28   2.8  3.3  1.1  0.1  NaN  NaN  13.4
29   4.8  1.1  0.9  0.8  1.4  1.9  10.2
30   3.1  2.6  1.3  0.3  1.6  2.1   9.8
31   5.2  3.1  0.7  0.5  2.3  3.1  16.1
32   6.3  0.9  0.6  0.7  1.6  2.7  13.8
33  10.1  0.7  0.6  1.4  2.0  2.3  11.4
34   2.8  4.3  1.4  0.2  1.9  1.7  13.1
35   8.3  4.2  1.0  0.4  2.3  2.1  11.7
36   4.3  1.1  0.8  0.6  2.3  2.5  10.3
37   3.9  2.7  1.1  0.3  1.9  2.0   9.7
38   5.2  3.4  1.1  0.4  2.2  2.5  12.6

[39 rows x 28 columns]
#use results from nba analysis to predict 3P% for draftees
X_draft = draft[["3P%","FT%"]]
X_draft = sm.add_constant(X_draft)

#add the prediction to the draft dataframe
draft["pred"] = result.predict(X_draft)
Now I will bring in the wingspan information provided from http://www.nbadraft.net/2016-nba-draft-combine-measurements.
ws = pd.read_csv('wingspan.csv')
ws.head()
draft.head()
draft = draft.merge(ws, on='Player')
draft_sorted = draft[['Player','Tm','FT%','3P%','pred','Ratio']]
draft_sorted = draft_sorted.sort_values(by='pred', ascending = False)

print(draft_sorted)
                Player   Tm    FT%    3P%      pred  Ratio
8         wade-baldwin  MEM  0.800  0.422  0.378774   1.12
20     malcolm-brogdon  MIL  0.876  0.365  0.378240   1.09
4          buddy-hield  NOP  0.836  0.390  0.377723   1.07
31        marcus-paige  BRK  0.844  0.375  0.376231   1.08
19          tyler-ulis  PHO  0.846  0.371  0.375818   1.08
10       malik-beasley  DEN  0.813  0.387  0.374653   1.05
7     denzel-valentine  CHI  0.779  0.408  0.374174   1.09
11        caris-levert  IND  0.770  0.401  0.372043   1.05
25   demetrius-jackson  BOS  0.837  0.348  0.371134   1.08
28       georges-niang  IND  0.763  0.375  0.367106   1.04
33      isaiah-cousins  SAC  0.711  0.407  0.366354   1.04
22       patrick-mccaw  MIL  0.753  0.367  0.364703   1.06
26         jake-layman  ORL  0.759  0.362  0.364581   1.02
24    isaiah-whitehead  UTA  0.757  0.359  0.363877   1.07
1       brandon-ingram  LAL  0.682  0.410  0.363566   1.09
6       taurean-prince  UTA  0.718  0.376  0.362196   1.06
32     daniel-hamilton  DEN  0.772  0.337  0.362056   1.04
30       joel-bolomboy  UTA  0.713  0.371  0.360835   1.08
13  malachi-richardson  CHO  0.720  0.353  0.358751   1.09
29          ben-bentil  BOS  0.761  0.324  0.358742   1.08
3            kris-dunn  MIN  0.693  0.354  0.355869   1.09
27     michael-gbinije  DET  0.639  0.388  0.355211   1.03
9       henry-ellenson  DET  0.749  0.288  0.351646   1.05
0          ben-simmons  PHI  0.670  0.333  0.349927   1.05
2         jaylen-brown  BOS  0.654  0.294  0.341902   1.08
12      deandre-bembry  ATL  0.628  0.312  0.341845   1.07
15       pascal-siakam  TOR  0.711  0.176  0.329493   1.09
16     skal-labissiere  PHO  0.661  0.000  0.295776   1.05
5         jakob-poeltl  TOR  0.607  0.000  0.289693   1.03
21      chinanu-onuaku  HOU  0.547  0.000  0.282934   1.07
14       brice-johnson  LAC  0.708    NaN       NaN   1.04
17       deyonta-davis  BOS  0.605    NaN       NaN   1.06
18       cheick-diallo  LAC  0.556    NaN       NaN   1.11
23       diamond-stone  NOP  0.761    NaN       NaN   1.07
Conclusion
Anchor Down Wade Baldwin! Hmm…Wade Baldwin is at the top of both my predicted 3P% as well as having the highest wingspan to height ratio. I didn’t get to see him play much but I think Memphis has a solid young (20 yo) backup point guard to Conley and possibly a great 3 and D contributor. According to my model Baldwin is the cream of the crop but other standouts include Malcolm Brogdon, Denzel Valentine, Brandon Ingram, and Malachi Richardson.
Again there are some improvements that could be made for this model as I assumed that college 3P% and college FT% correlates with high NBA 3P%. There might be some other stats that might be better predictors including TS% and what team they are drafted by (Spurs and Warriors seem to emphasize and improve their players’ 3P%).
With league average 3P% of 35.4% last year and average wingspan ratio of ~1.6 I would expect anyone with above average 3P% and above average ratio to have the ability to be a solid 3 and D player. So below is the list of all players with pred > 35.4% and Ratio > 1.06.
threeAndD = draft_sorted[draft_sorted['pred'] > .354]
threeAndD = threeAndD[threeAndD['Ratio'] > 1.06]
threeAndD = threeAndD.dropna()
print(threeAndD)
                Player   Tm    FT%    3P%      pred  Ratio
8         wade-baldwin  MEM  0.800  0.422  0.378774   1.12
20     malcolm-brogdon  MIL  0.876  0.365  0.378240   1.09
4          buddy-hield  NOP  0.836  0.390  0.377723   1.07
31        marcus-paige  BRK  0.844  0.375  0.376231   1.08
19          tyler-ulis  PHO  0.846  0.371  0.375818   1.08
7     denzel-valentine  CHI  0.779  0.408  0.374174   1.09
25   demetrius-jackson  BOS  0.837  0.348  0.371134   1.08
24    isaiah-whitehead  UTA  0.757  0.359  0.363877   1.07
1       brandon-ingram  LAL  0.682  0.410  0.363566   1.09
30       joel-bolomboy  UTA  0.713  0.371  0.360835   1.08
13  malachi-richardson  CHO  0.720  0.353  0.358751   1.09
29          ben-bentil  BOS  0.761  0.324  0.358742   1.08
3            kris-dunn  MIN  0.693  0.354  0.355869   1.09
Typically it seems rookies and even second year players struggle on the defensive end until they can adjust to the NBA competition. However looking at the recent players coming from college I would expect these players to be possible contributors to floor spacing and defensive disruptions in the near future.
threeAndD.head(len(threeAndD))
| Player | Tm | FT% | 3P% | pred | Ratio | |
|---|---|---|---|---|---|---|
| 8 | wade-baldwin | MEM | 0.800 | 0.422 | 0.378774 | 1.12 |
| 20 | malcolm-brogdon | MIL | 0.876 | 0.365 | 0.378240 | 1.09 |
| 4 | buddy-hield | NOP | 0.836 | 0.390 | 0.377723 | 1.07 |
| 31 | marcus-paige | BRK | 0.844 | 0.375 | 0.376231 | 1.08 |
| 19 | tyler-ulis | PHO | 0.846 | 0.371 | 0.375818 | 1.08 |
| 7 | denzel-valentine | CHI | 0.779 | 0.408 | 0.374174 | 1.09 |
| 25 | demetrius-jackson | BOS | 0.837 | 0.348 | 0.371134 | 1.08 |
| 24 | isaiah-whitehead | UTA | 0.757 | 0.359 | 0.363877 | 1.07 |
| 1 | brandon-ingram | LAL | 0.682 | 0.410 | 0.363566 | 1.09 |
| 30 | joel-bolomboy | UTA | 0.713 | 0.371 | 0.360835 | 1.08 |
| 13 | malachi-richardson | CHO | 0.720 | 0.353 | 0.358751 | 1.09 |
| 29 | ben-bentil | BOS | 0.761 | 0.324 | 0.358742 | 1.08 |
| 3 | kris-dunn | MIN | 0.693 | 0.354 | 0.355869 | 1.09 |